Utah Snow Accumulation Study: EDA and Findings
A conclusion to my study on Utah snow data; findings and takeaways.
Study Introduction
To reiterate from my last post: in recent decades, Utah and surrounding states in the U.S. have been experiencing a long-term drought. For the western region of the U.S., one of the primary sources of these conditions may be the continuously changing patterns in snow supply (primarily mountain snow). For communities in this region, winter snowpack is one metric used to determine the quality of the upcoming year when it comes to precipitation levels. This metric, of course, determines more than just simple annual precipitation—it also alludes to the success of an economy fractionally built upon agriculture and recreational activities, including golf, water sports, and skiing. Despite the surgeance of this drought, if there is, truly, a steady decrease in snowpack, is it due to lowering levels of seasonal precipitation, or is it mainly due to shifting patterns of weather based on global warming trends, thus reducing snowpack via a shortened winter season? My study tackles this question and provides support for the latter claim—that Utah is experiencing more and more of a warmer winter season rather than a drier season. This is according to the data I have extracted from USDA sites as well as my analysis of such observations.
I scraped observations from the USDA’s Air & Water Database. The next sections discuss the results of my study, along with answers to the following: is there evidence of a decrease in seasonal snowpack, and if so, what evidence is there to attribute it to the ongoing drought versus irregular fluctuations in weather patterns due to global warming trends?
Findings and Insights
My data scraping and wrangling methods can be found in my previous post, Utah Snow Accumulation Study: Intro and Web Scraping Walkthrough. My cleaned dataset includes monthly snowpack (e.g. “Jan” and “May”) observations as well as the estimated Water Equivalence (e.g. “Jan (WE)” and “May (WE)”) levels for each SNOTEL Site, and is ordered by “Water Year” or the observed year:

I customized additional factors, including a “Decade” variable to prepare for comparisons between subsets of data grouped by decade.
My research was prompted by certain correlation trends spotted in the following correlation heatmaps (grouped by month collected):
January & May
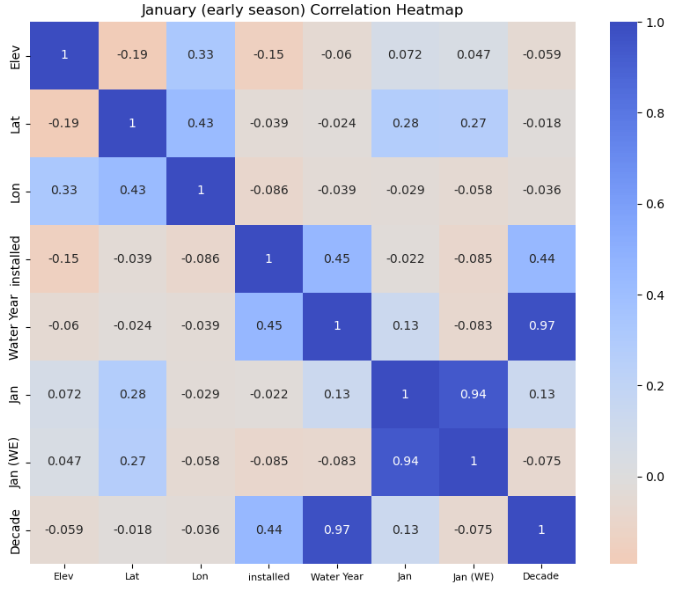
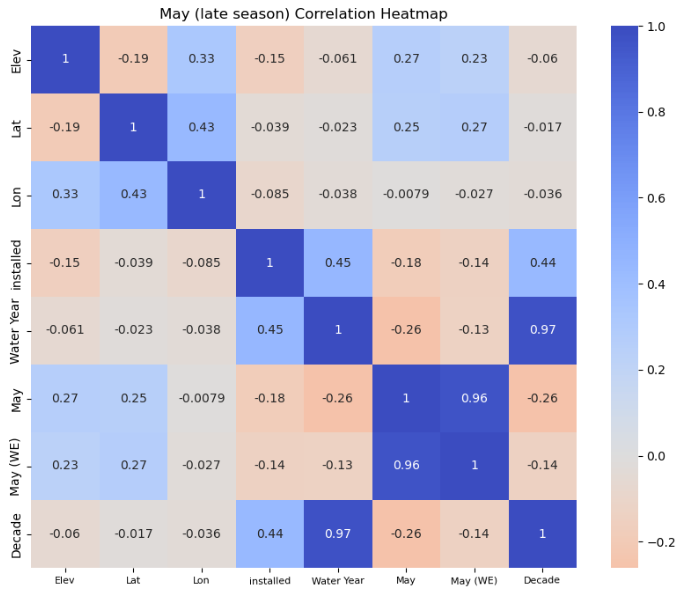
The heatmaps depict a general trend of decreasing correlation between the monthly snowpack/water equivalent factors with factors of time, including decade, water year, and year installed (see Dashboard for other months). It may be interpreted that as the months progress into the later season (Spring months), levels of snowpack gradually shrink at larger rates as the decade variable and other time factors increase. This will be explored further, but additional relationships must be analyzed, such as elevation and location (Lat/Lon) with snowpack—strong correlations here would prove difficult to isolate and analyze the relationship between snowpack and time variables.
Out of these potentially underlying factors of snowpack as time increases, I first took a look at the locations of these sites by year and by decade:
Year in Use (SNOTEL Sites)
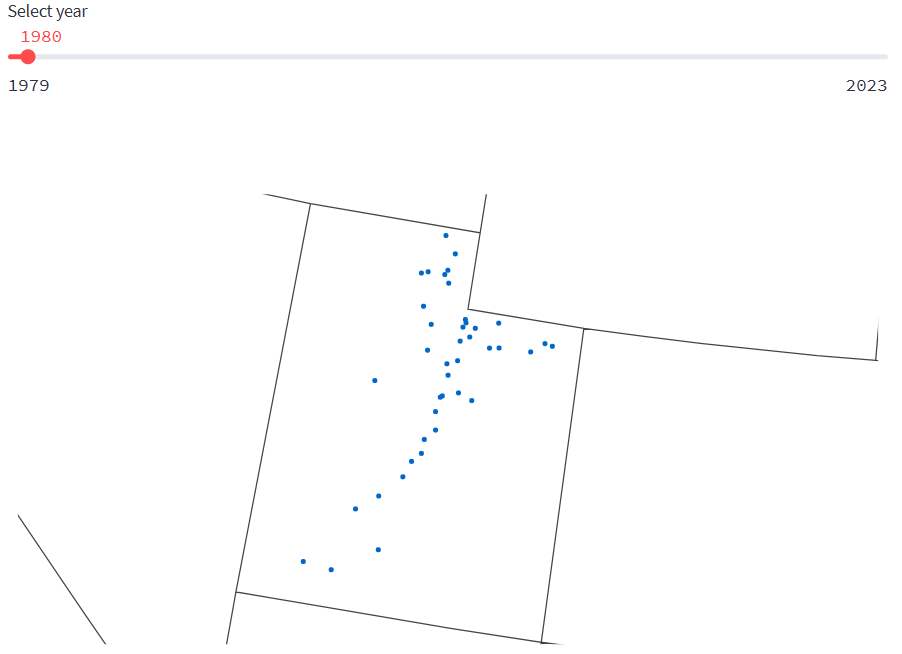
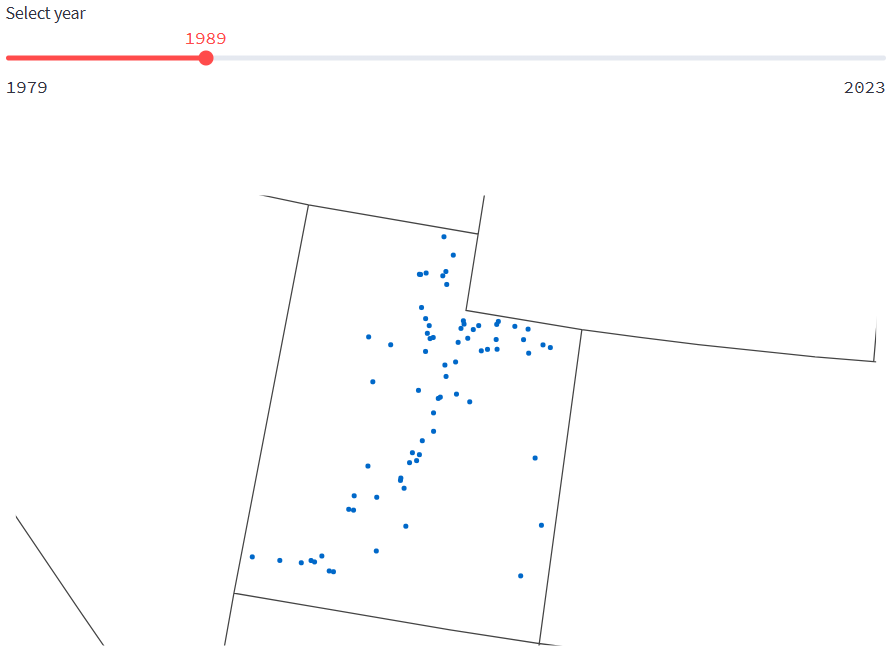
Decade in Use (SNOTEL Sites)
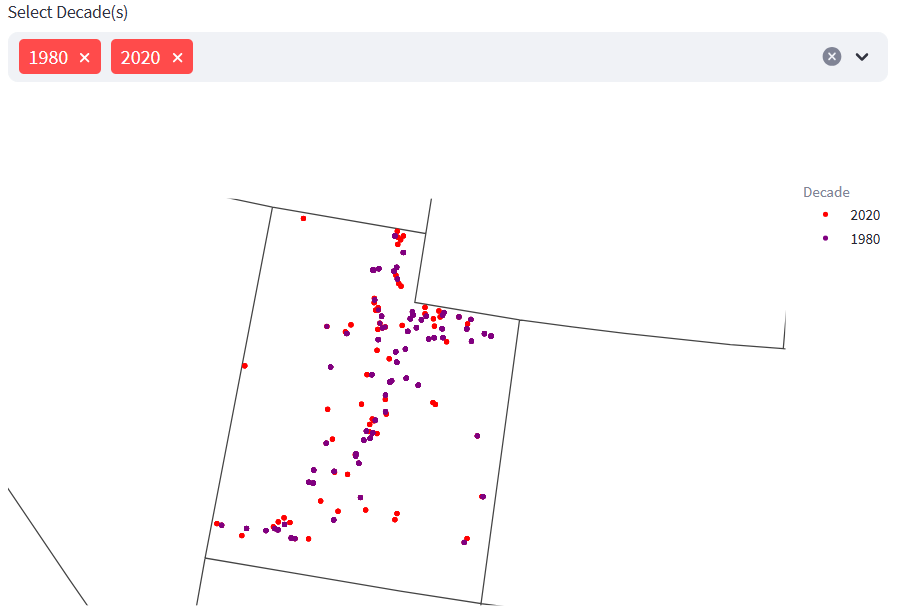
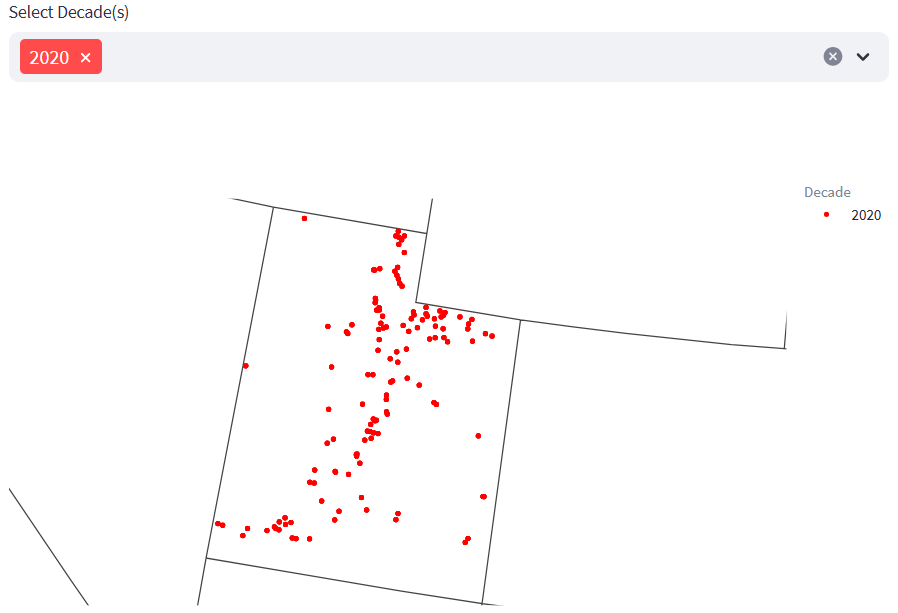
The geo-scatterplots determine whether the SNOTEL Sites are evenly spread across the state—it is, more or less, a metric showing how well each year or decade “represents Utah”. The above plots show the sites that are in use for the given year; for the decade of 1880, it is observed that from the first year, operating sites are fairly distributed throughout the state. This decade is perhaps the most lopsided, but from end-to-end, it represents the state overall (one reason for comparing data grouped by decade rather than by year). Additionally, I compared the decades of 1980 and 2020, where the purple indicates which sites were used in 1980, and red indicates the sites used in 2020—because of overlap, the second plot is employed to identify the sites from 1980 that were also used in 2020. The results show that these two decades are comparable in representing the state (decades in between show similar patterns). Also, for the 1980 decade, I included the years 1978 and 1979 which were the first years SNOTEL tech was used, and the 2020 decade includes years 2020-2023.
Having confirmed even location distribution for each decade, I then analyzed elevation to check if sites in each decade shared not just a similar two-dimensional location but also exhibited a consistent altitude pattern:
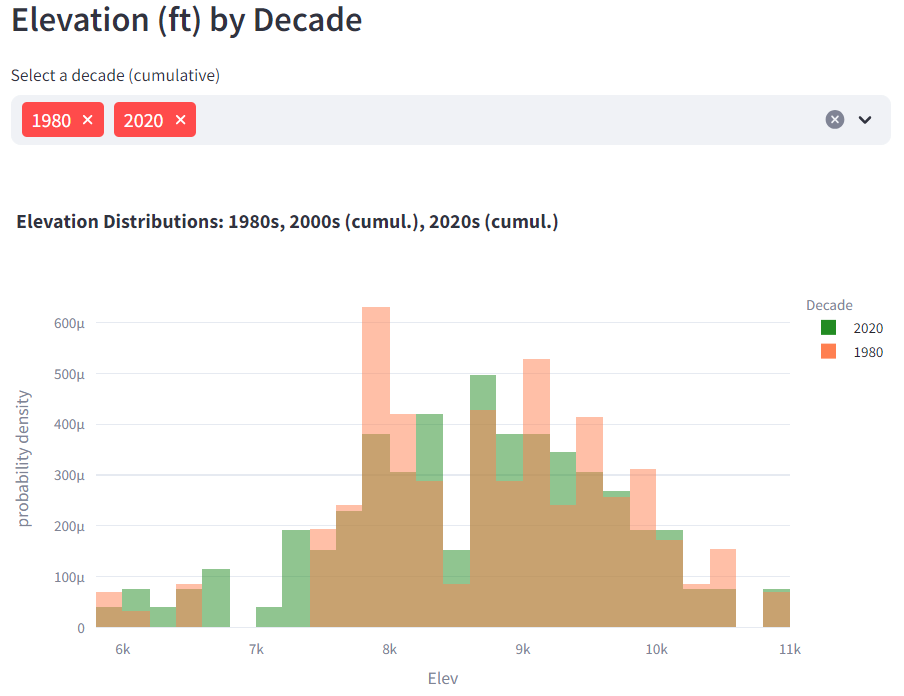
This offers evidence that the elevation distribution for SNOTEL Sites is fairly consistent across decades. The correlation heatmaps further reveal that, while the relationship between elevation and installment year is somewhat discernible, elevation by decade (and elevation by observed year) is relatively miniscule, and arguably neutral.
The final check before comparing decade subsets by their snowpack levels involved confirming whether or not the relationship between snowpack/water equivalence and elevation was consistent for each month across different decades. If the regression slopes and patterns for the month of May were very different between decades, for example, it could raise concerns about the nature of snow across elevation levels changing for one decade compared to others—this may include changes in water content in snow at certain altitudes or in specific regions of Utah, etc. If it stays consistent, though, then the “snow type” (nature of water equivalence) is roughly the same across decades.
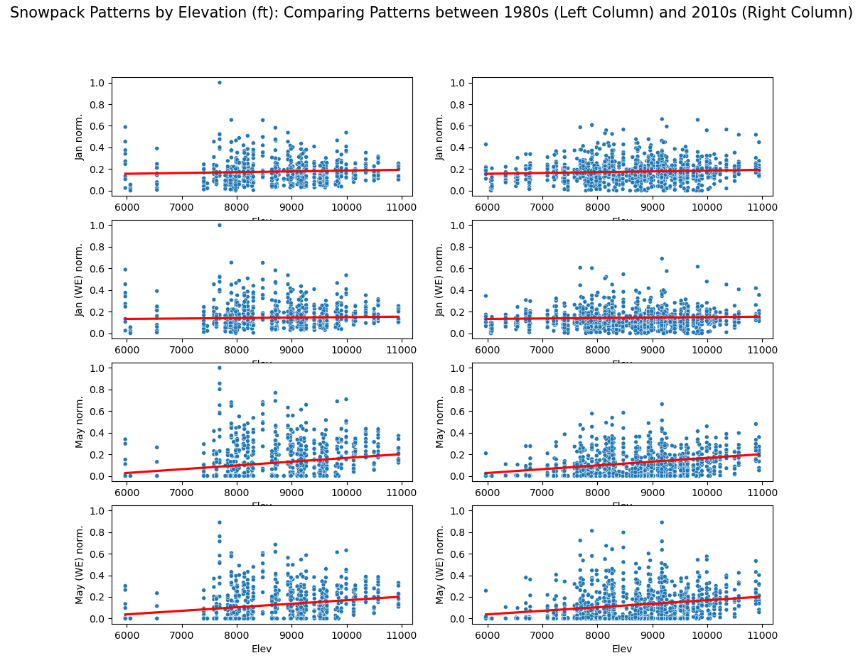
The scatterplot matrix depicts the regression slopes for each month as similar, and slope computations indicated that they are nearly equivalent. Thus, across decades, snowpack levels will indicate, more or less, the same relationship with water equivalence.
Lastly, I ran the following EDA models to determine the distributions of snowpack level based on certain decade subset combinations:
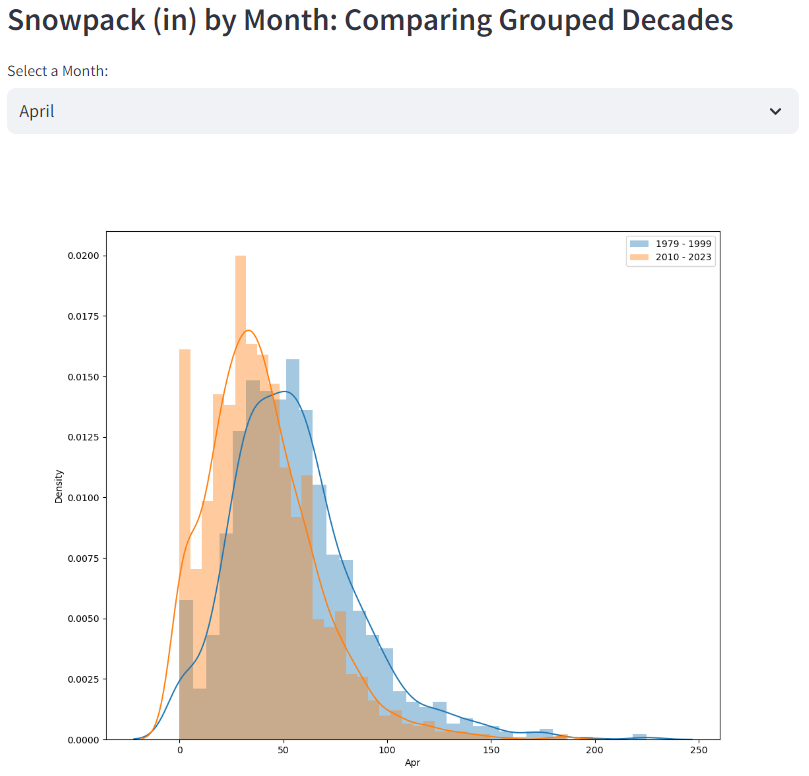
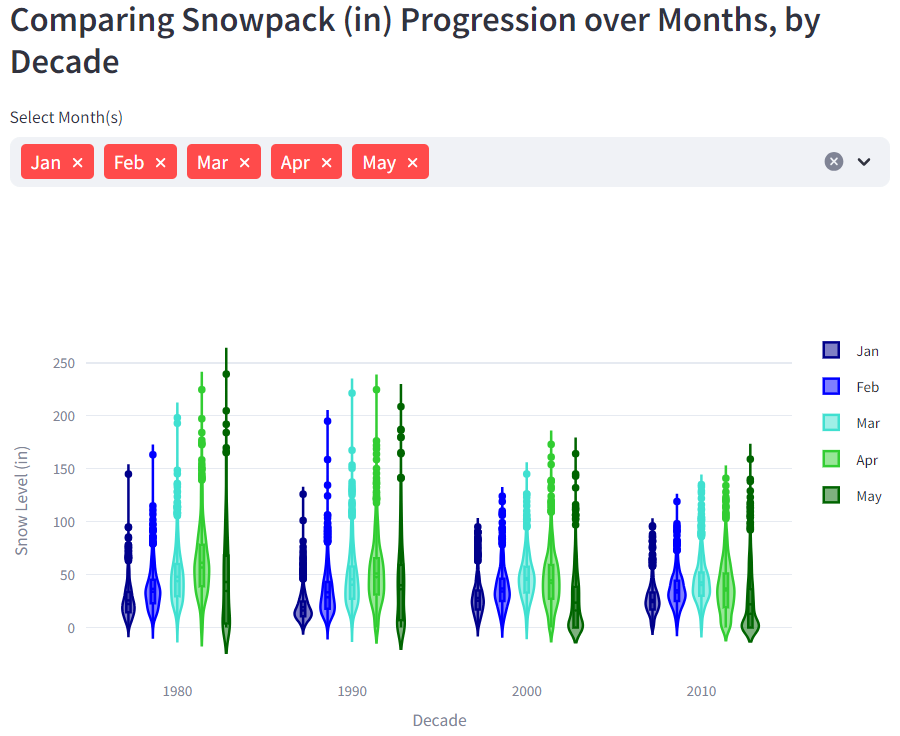
The left figure is comparing the combined decades of 1980 and 1990 (1979-1999) to 2010 and 2020 (2010-2023)—basically the extremes of earlier decades to later decades. It is crucial to compare this plot (April) to the other months in order to analyze the overall trend (see Dashboard). It is observed that in the early season (January-February), the snowpack distribution for the later decades is centered around higher levels than the distribution for earlier decades. However, as the months progress into the later season (April-May), the distributions gradually switch, with the snowpack distribution for earlier decades seeing higher levels at its median. The right figure groups the data by individual decade (1980-2010), and then the snowpack distribution for each month is compared across these decades. It is evident that earlier months are more comparable across decades (although there are more extreme values in earlier decades), but as the season continues, later months see significant differences across decades.
Key Takeaways and Final Thoughts
In comparing the snowpack distribution of earlier decades to later decades, I am visualizing the trend of decreasing correlation between observed snowpack and time factors (decade and water year) as depicted in the month-to-month correlation heatmaps. This suggests a “shortening winter season” trend in Utah over time. In other words, there is more evidence based on these results that the state is experiencing shorter winters—with spring months such as April and May seeing warming temperatures and thus more rain than snow—rather than drier winters. The reason for this is because, according to the snowpack levels observed in the early season (January and February), later decades are relatively fine, if not better, compared to earlier decades. The violin plot comparing individual decades also supports this claim, as we see that while extreme levels of snowpack are more prevalent in earlier decades, the median snowpack level for January and February is pretty much the same across all decades, if not greater in 2000 and 2010. In contrast, the later-season months of April and May have clearly seen an overall decrease in snowpack as time progresses. Thus, these results suggest that January and February consistently reach below freezing across decades. Hypothetically, if winter precipitation levels are generally the same, these earlier months will see similar patterns in snowpack. However, if the temperature is typically increasing at a faster rate in later years, the consistent patterns of precipitation will take the form of rain rather than snow in spring.
It is evident that Utah is experiencing a gradual decline in snow accumulation as the years pass, but there’s not much support for the claim that this is due to the recent long-term drought. More than anything, this study suggests that the winter season is experiencing fluctuating weather patterns and temperature shifts due to global warming trends. I would encourage the USDA and Utah Division of Water Resources to look further into these patterns, along with monthly temperature and rain data. There is, clearly, a long-term drought occurring in the western US. But perhaps it’s due more to drier summers, or maybe communities in Utah are more prepared to conserve water from mountain snow, rather than early-spring rainfall. It is possible to adapt to these weather changes, which is why it is so important that we improve our understanding of them.
Links
Utah Snow Accumulation Study: Intro and Web Scraping Walkthrough (first blog post)